BELLUNA
![]()
BELLUNA
![]()
(unit: million yen)
| 2019/3 | 2020/3 | 2021/3 | 2022/3 | 2023/3 | |
|---|---|---|---|---|---|
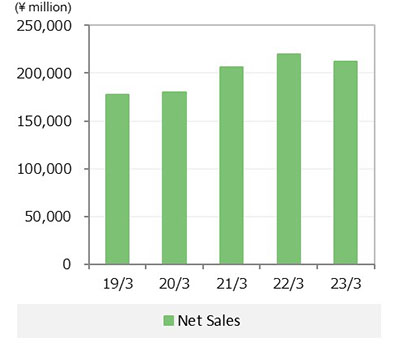
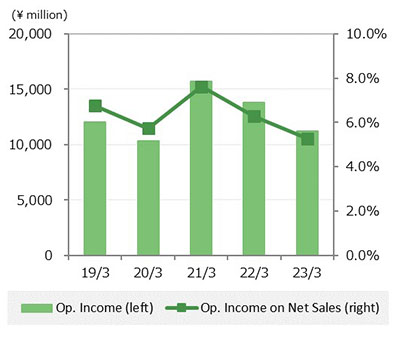
| Net Sales | 177,648 | 179,948 | 206,499 | 220,128 | 212,376 |
| Cost of Sales | 76,275 | 74,908 | 84,935 | 90,822 | 86,674 |
| Gross Income | 101,372 | 105,040 | 121,564 | 129,305 | 125,701 |
| Selling and General Expenses | 89,359 | 94,751 | 105,821 | 115,478 | 114,484 |
| Operating Income | 12,005 | 10,311 | 15,734 | 13,827 | 11,217 |
| Recurring Income | 15,309 | 10,365 | 16,872 | 14,537 | 12,459 |
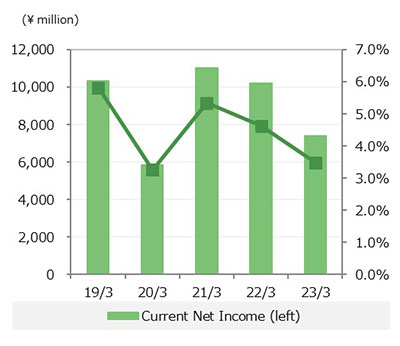
| Current Net Income | 10,343 | 5,862 | 11,036 | 10,204 | 7,417 |
(unit: million yen)
| 2019/3 | 2020/3 | 2021/3 | 2022/3 | 2023/3 | ||
|---|---|---|---|---|---|---|
| ASSETS | ||||||
| Current Assets | 99,244 | 103,683 | 115,534 | 118,133 | 122,664 | |
| Total Fixed Assets | 114,542 | 119,445 | 124,677 | 136,045 | 162,928 | |
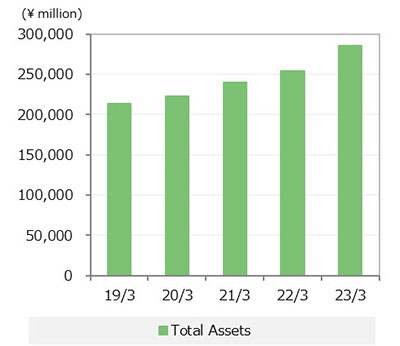
| Total Assets | 213,786 | 223,128 | 240,211 | 254,178 | 285,592 | |
| LIABILITIES and NET ASSETS | ||||||
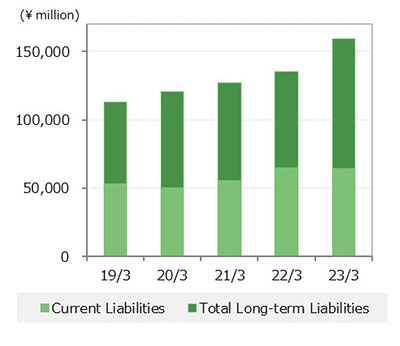
| Current Liabilities | 53,463 | 50,135 | 55,645 | 64,904 | 64,587 | |
| Total Long-term Liabilities | 59,790 | 70,467 | 71,334 | 70,229 | 94,568 | |
| Total Liabilities | 113,253 | 120,602 | 126,980 | 135,134 | 159,155 | |
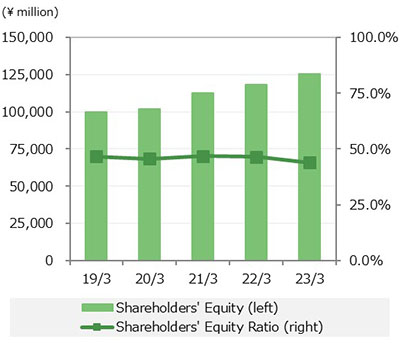
| TOTAL SHAREHOLDERS' EQUITY | 102,215 | 106,253 | 115,752 | 124,228 | 129,765 | |
| Common stock | 10,612 | 10,612 | 10,612 | 10,612 | 10,612 | |
| Capital Surplus | 10,954 | 10,954 | 10,954 | 10,951 | 10,951 | |
| Retained earnings | 80,816 | 85,177 | 94,667 | 103,131 | 108,663 | |
| Treasury stock | (167) | (491) | (481) | (467) | (462) | |
| Total Accumulated Other Comprehensive Income | (2,385) | (4,363) | (3,132) | (5,959) | (4,268) | |
| Total Minority Interests | 703 | 636 | 611 | 775 | 940 | |
| Total Net Assets | 100,533 | 102,525 | 113,231 | 119,044 | 126,436 | |
| TOTAL LIABILITIES and NET ASSETS | 213,786 | 223,128 | 240,211 | 254,178 | 285,592 | |
(unit: million yen)
| 2019/3 | 2020/3 | 2021/3 | 2022/3 | 2023/3 | |
|---|---|---|---|---|---|
| Cash Flows From Operating Activities | 8,558 | 6,624 | 20,772 | 7,154 | 8,241 |
| Cash Flows From Investing Activities | (12,724) | (11,108) | (5,185) | (17,033) | (29,924) |
| Cash Flows From Financing Activities | 3,577 | 5,712 | (6,996) | 8,652 | 23,527 |
| Effect of exchange rate change on cash and cash equivalents |
(88) | (286) | 72 | (162) | 414 |
| Net increase(decrease) in cash and cash equivalents | (677) | 941 | 8,662 | (1,389) | 2,259 |
| Cash and cash equivalents at beginning of period | 22,028 | 21,351 | 22,292 | 30,958 | 29,569 |
| Cash and cash equivalents at end of period | 21,351 | 22,292 | 30,958 | 29,569 | 31,828 |